Being in public healthcare has created greater impetus for me to find more datasets relating to different aspects on Singapore, from the economy, to society, and of course, healthcare. Some of these statistics have been made publicly available through the Singapore Department of Statistics so I tried my hand at exploring some of these numbers.
Singapore’s Public Data
Some of the richest sources of publicly available data on Singapore are at Data.gov.sg, Singapore Department of Statistics (SingStat) and LTA DataMall. DataMall focuses on public transport and transport infrastructure while Data.gov.sg and SingStat cover a broad range of topics. Data.gov.sg and LTA DataMall provide real-time APIs, geospatial information as well as static/ historical datasets. On the other hand, SingStat provides static/ historical datasets.
I found that the healthcare related datasets in SingStat appear to be more comprehensive. I’ve taken some of the data, formatted them slightly and put them up on a Tableau dashboard, Healthcare in Singapore. More on each chart set of data below!
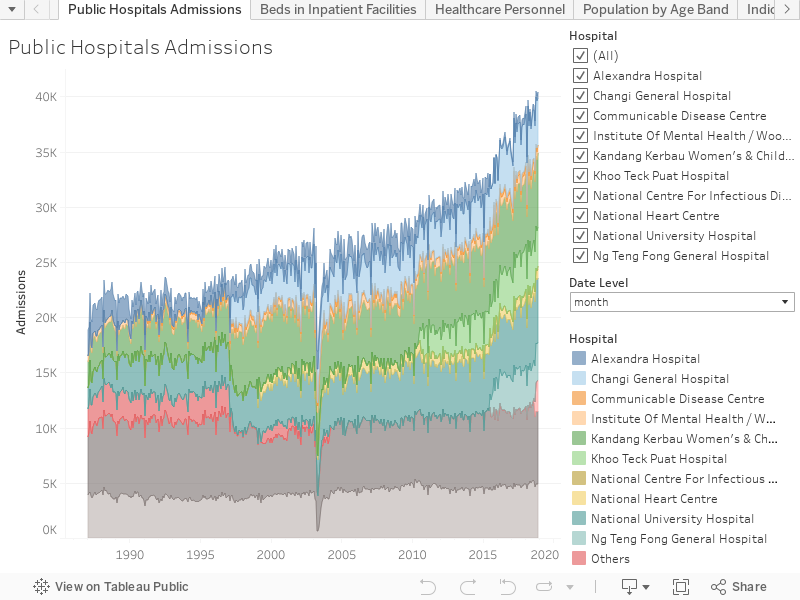
Public Hospital Admissions
The first tab, public hospital admissions, track the monthly admissions to public hospitals since 1987. As expected, the number is growing in recent years with the ageing population. While new hospitals are taking on the additional load, what’s interesting was that around the period Ng Teng Fong Hospital came into the picture, the total admissions had a slight jump. It seems like the hospital not just took the load off other hospitals but ‘generated’ more admissions than the natural growth rate.
Couple of possible reasons I can think of for now. The new public hospital might be taking on some of the admissions that was previously with private hospitals. It may also be that there previously weren’t sufficient beds, and previous numbers do not capture the actual required admissions. The opening of the hospital thus allowed some of these admissions to show up. Finally, a little similar to the second reason, would be that the presence of a conveniently located hospital encouraged more people to visit the doctor when unwell, and some ended up having to be admitted. Without the hospital they may have chosen not to travel to visit a hospital, with potentially serious consequences.
In either aspect it would appear that Singapore as a whole is now able to receive better healthcare. On the other hand if there was some sort of ‘latent’ admissions, the challenge would then be how to forecast and provide sufficient resources if the current data does not fully capture the actual demand.
Beds in Inpatient Facilities
The second dataset and chart covers beds in inpatient facilities. This includes acute hospitals, community hospitals, hospices, nursing homes and psychiatric hospitals, split by public, private and non-profit hospital types. This second set is tracked from a later period, from 2006. While overall bed numbers are rising, most of it is led by the public sector, with growth in private hospital beds at a slower pace. There appears to also be a strong trend of growth in nursing home beds. Finally, not all seems to be growing, as psychiatric beds have been on a slight decline since the start of the period.
Healthcare Personnel
Next, the number of healthcare personnel by profession. The figures are available for different professions starting at different years. I’ve applied a cutoff the make them all start at the same period, in 2008. Over the last 10 years most healthcare professions have seen a growth in numbers, but the trends do differ.
One group of professions have been experiencing high growth in numbers throughout the period. In this group there are Advanced Practice Nurses, Registered Nurses, Pharmacists, General Dental Practitioners and Specialist Doctors.
The next group are experiencing smaller or shrinking growth rates or have started to decline slightly. Here, there are Enrolled Nurses, Oral Health Therapists, Dental Specialists, Non-Specialist Doctors and TCM Doctors.
Finally, there has been a significant and steady decline in the number of Registered Midwives over the period.
Population by Age Band
SingStat also provides the resident population in Singapore by age band from 1957. To explore the relative size of each age band to the overall population, a stacked chart like this would be more useful. However in this case I’ve used lines for each age band as I wanted to see if it was possible to project the size of each age group in the next period. Probably a function of previous periods’ data points for that age band to be predicted, as well as data points for younger age bands in previous periods. E.g. the number of 0-4 years old residents today is likely to a strong predictor of the number of 5-9 years old residents in 5 years time.
Indicators Index
Finally, I picked out some statistics to build an index (100 at year 2006) to see how each of these major groups have grown over the last 12 years. Did some simple processing to get the numbers together on an easy to compare basis of growth rates.
Population
Firstly, on elderly population growth rates. Regardless of whether elderly is defined as 60+, 65+ or 70+, the number has grown significantly since 2006. The 70+ group grew the least, and has almost doubled in 12 years. The 60+ group, which experienced a spurt between 2009 and 2011, has grown by the most. In 2018 it is 2.3 times the number in 2006.
Admissions
Admissions to hospitals, on the other hand, grew at a lower rate, to “just” 50% more at 2018 than at 2006. However, community hospital admissions shot up starting in 2014, and is in 2018 closing on 3 times the number in 2006. Accident and Emergency departments in public hospitals had really high growth in attendance numbers up to 2013, where something held the attendance steady (zero to negative growth) ever since.
Attendances
Growing at a higher rate are day surgeries and polyclinic attendances, at around 1.7 times in 2018 compared to their 2006 numbers. At public healthcare institutions, specialist outpatient and dental clinics were at a lower band in the 1.3-1.4 range.
Beds
As noted earlier community hospitals growth in number of beds have been very noticeable in recent periods, in 2018 reaching 230% of the number of beds in 2006. Acute hospital beds, on the other hand, reached just 130% of the beds in 2006. The lower growth rate of acute hospital beds versus the growth in admissions would not automatically mean a bed scarcity issue though, as the length of stay of patients is a vital aspect to calculating bed availability.
Personnel
Finally, on personnel. The number of doctors and nurses seem to be growing in line from 2006 to 2018, both doubling over the period. This would maintain the ratio of doctors and nurses to population above 70 at the same level as 2006. Dentists are growing at a lower rate to 170% of the 2006 numbers, while pharmacists are as of 2018 almost 230% of the 2006 numbers.
Healthcare in Singapore on Tableau
And that’s it for a quick overview of selected datasets on healthcare from SingStat. Any thoughts on the data? Ideas on what I should explore next? Let me know in the comments below. Meanwhile if you don’t wish to load the Healthcare in Singapore Tableau dashboard here’s an embedded version!