Few months back I embarked on a new journey- still in data science, but in the field of public healthcare. Quite a change from the world of travel and web analytics. The domain of healthcare is vast and foreign, with nuances aplenty.
Given the depth and importance of the field though, much has been done in creating common global standards for defining medical concepts, such as with medical diagnosis codes. While the way to describe a medical event is pretty concise and precise with specific codes, these codes aren’t really machine-tasks friendly. The number of unique codes is still significant (tens of thousands) and while being semi-structured, do not represent the myriad of dimensions relating to each condition.
It appeared to be a similar problem to that of describing words in a multi-dimensional numeric representation for machine-tasks. Embeddings, in this aspect, have changed how people (or at least those in the field of data science) perceive language, from one difficult to quantify to one well suited for statistical analysis and modelling with machine learning algorithms. Could embeddings do the same for medical diagnosis codes?
International Statistical Classification of Diseases and Related Health Problems (ICD)
Each medical episode (a visit to a doctor, a stay in the hospital) generates a huge amount of information. Some of it is structured, such as patient vitals and lab results. On the other hand, unstructured data such as scan images and doctor notes still constitute the bulk in documenting these episodes.
In order to facilitate the curation and discussion of medical information across healthcare facilities over the world, a common standard of describing medical concepts and diagnoses was created by the World Health Organization. This standard is known as the International Classification of Diseases (ICD). There are also other global standards available but I’ll focus on ICD for now (specifically, ICD-10).
What happens at healthcare facilities (some, not all) is that after all the structured and unstructured data from an episode has been collected, medical coders will assess the episode in its entirety and assign the relevant ICD codes to it. With each episode transcribed into globally recognized codes, medical institutions have a common language for discussing and sharing information.
However, ICD codes are not easily interpretable, and lots of experience and knowledge is required to make sense of them. There are over 70,000 different codes in the ICD-10-CM standard (one of the variants). As short alphanumeric strings, ICD codes, while holding a huge amount of information, is a categorical variable which, as a huge, sparse input would in its raw form not be very useful for machine-tasks and analysis.
Lower dimensional representations of medical codes
As such, being able to represent ICD codes in a lower dimensional, dense format that captures the relationships between different ICD codes would make a difference to models where information on the diagnoses in an episode is helpful or even crucial to the model’s utility.
The idea of representing medical codes in a lower dimensional space for more usability is not a new one. For example, comorbidity indexes are curated mappings of medical codes to disease groups, each group with a score that is related to the risk of dying from each. As with other attempts to manually group and scale unstructured data, human biases and limits to human perception result in these groups and scales not being able to sufficiently describe the unstructured data beyond a narrow scope.
Embeddings, as elaborated on in my previous post, is a way of mapping unstructured data onto a n-dimensional vector space. n is usually chosen in magnitudes smaller than the number of possible values in the input field. A popular rule of thumb is the 4th root of the number of unique input values. Input data is fed through the embedding layer to predict a target output. Through iterations, the embedding layer ‘learns’ to represent each input value at the appropriate point in vector space that would capture each value’s relationships.
When completed, not only do we have a more compact representation of the data, but also have more meaningful (may not be human interpretable) dimensions (not just 1s and 0s) that express relationships between diagnoses along various scales (the dimensions), as long as the embeddings layer was trained with the appropriate context and with sufficient dimensions and data.
Literature review
I did some googling and as expected, there seems to have been previous work started on embeddings of medical concepts and ICD codes. Here are some of the works I found relevant:
- Learning Low Dimensional Representations of Medical Concepts
- Snomed2Vec: Random Walk and Poincaré Embeddings of a Clinical Knowledge Base for Healthcare Analytics
- Interpretable ICD Code Embeddings with Self- and Mutual-Attention Mechanisms
- How Medical Concept Embeddings Can Help Reduce Billing Errors
I’ve gotta admit I didn’t read them in detail till I got to writing this post, but they’re definitely way more detailed and thorough than I intend to get. What I needed was a basic, general purpose embedding layer of ICD codes that would be quick to develop/ deploy and that I could validate across a number of basic tasks related to operational and finance aspects of healthcare. This embedding were not readily available, so I set off building one on my own.
Adapting word embedding concepts for medical codes – it’s all in the context
I took inspiration from Word2Vec and decided to start out with a simplistic adaptation. The underlying idea in Word2Vec is that the meaning of a word can be learnt from the words that are found around it (the context). Skipping the details, you can check out a visualization of Word2Vec’s word embeddings on the Embedding Projector. The embedding projector allows you to explore multi-dimensional embeddings in a 2d or 3d space. Much information is lost in the dimension reduction (n-dimensions to 2d or 3d), but you’d still be able to obtain the vector space distance/ similarity between 2 points on the right-hand pane.
Applying this to ICD codes, each episode generally has one or more associated diagnosis codes. Assuming there is some structure in how illnesses occur, each ICD code in an episode can be defined as a target, with the other co-occurring ICD codes as the context. One limitation would be processing ICD codes that almost always occur on their own, without co-occurring ICD codes. Other than such cases, the model should be able to learn the relationships between ICD codes. ICD codes would be deemed similar in vector space not because they often occur together, but because they often occur with similar contexts.
To keep things simple, I took all possible pairs of ICD codes from each episode and fed them through through a basic network. The network was made up of the input, an embedding layer, and finally a dense layer (a by-product) to predict the output. For example in an episode with 3 diagnoses A, B and C, there will be 6 training examples generated:
| Input (X) | Output (Y) |
| A | B |
| A | C |
| B | A |
| B | C |
| C | A |
| C | B |
Visualizing medical diagnosis code embeddings on Embeddings Projector
Not going into more technical details but one way to try to see what it does is to visualize the output. I have made the ICD codes embedding output available here, trained on a sample of inpatient episodes. Do note that since the input data size was not very big, output and accuracy is limited.
At this point it is important to note that the main goal of creating embeddings is not to make ICD codes more understandable to humans, but to make it more understandable to machines, so that the machine can leverage on diagnosis codes to generate insights or enhance models. The success of this embeddings is not in how well it reflects human understanding of the relationships between the codes (though a quick and dirty proxy), but in how analysis or modelling work is able to achieve better performance when the embeddings are applied (compared to without it).
Applying embeddings to actual problems
In order to evaluate if the trained embeddings of ICD codes are on track for use on general tasks, I tested them on couple of small tasks with simplified assumptions. The three tasks I tested it on were: predicting inpatient episode cost, predicting inpatient length of stay and predicting inpatient episode mortality. The other methods used to benchmark/ compare the performance were Charlson Comorbidity Index (22 conditions), Elixhauser Quan Comorbidity Index (30 comorbidities) and groupings by ICD chapters (22 chapters).
To keep things simple I fed the data through an OLS regression to compare how the indexes/ groupings/ embeddings in their raw form are correlated with the target outputs, without adding any fancy transformations or components. Not expecting much in terms of accuracy, but if these indexes/ groupings/ embeddings have captured at least some of what the diagnosis codes mean then they should show some relationship to the 3 target outputs.
After converting each diagnosis code into the corresponding representations, I tested 2 aggregation methods to approximate diagnosis codes to the episode – taking the sum of each dimension, and taking the maximum of each dimension. I’d be interested to explore better ways of aggregating diagnoses into episodes in future but for now, 2 pretty straightforward methods. Each episode’s values for each dimension is then fed through the OLS regression to obtain the R-squared metric, and then through and XGBoost regressor out of the box to obtain the RMSE metric. Not very scientific, more of a quick POC. Due to potential sensitivity of the data I’ve shown the results relative to using ICD chapter groupings, rather than the raw figures.
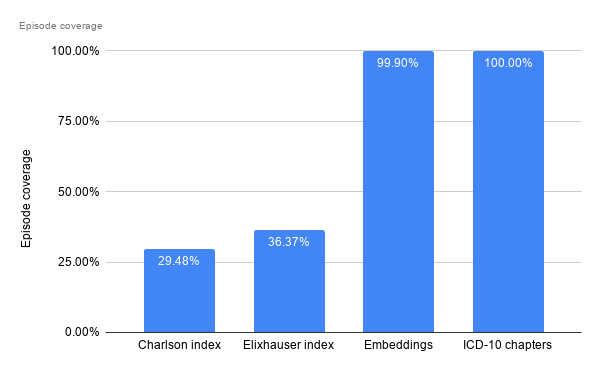
Episode Coverage
This refers to the proportion of episodes that have at least some corresponding input to use downstream. For the comorbidity indexes, some diagnosis codes do not map to any comorbidity grouping, and thus some (or rather, most) episodes are left with all nulls, thus not being usable downstream. Filtering out those cases without a single comorbid group identified, only 29% and 36% of inpatient episodes can be analysed further, for the Charlson and Elixhauser index respectively,
Since every ICD code has a corresponding chapter, and each episode has at least one ICD code assigned, all episodes have at least one ICD chapter assigned and thus coverage is 100%. For embeddings, since I’ve dropped diagnosis codes with very little occurrences, there are a small portion of episodes which end up with no relevant embeddings found to represent them.
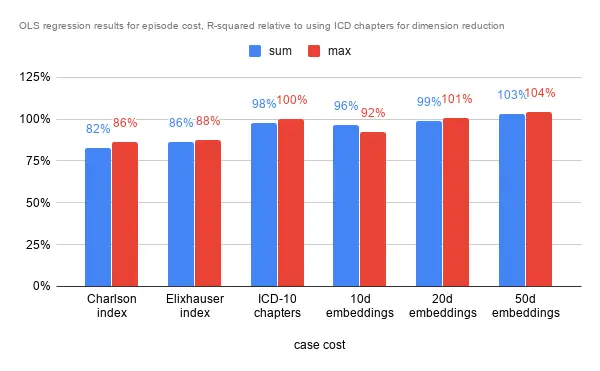
Predicting Inpatient Episode Cost
In terms of R-squared, performance is largely similar. The comorbidity indexes fare slightly worse than the benchmark, while the 20 dimensional and 50 dimensional embeddings fare marginally better. That the 10 dimensional embeddings fare worse may indicate that 10 dimensions are insufficient to describe the data. There are 22 chapters, which may explain the similar performance to the 20d embeddings. As with the analysis below, the higher dimensional embeddings is almost always associated with better results as it has more room to capture information and nuances.
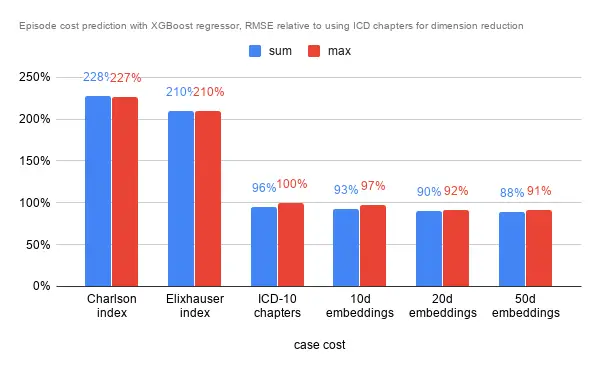
In terms of RMSE on a hold out set though, the story was slightly different. The indexes fare rather poorly regardless of aggregation method for the episode. ICD chapters and embeddings again were close in performance, but the 50 dimensional embeddings managed to squeeze an almost 10% improvement in RMSE.
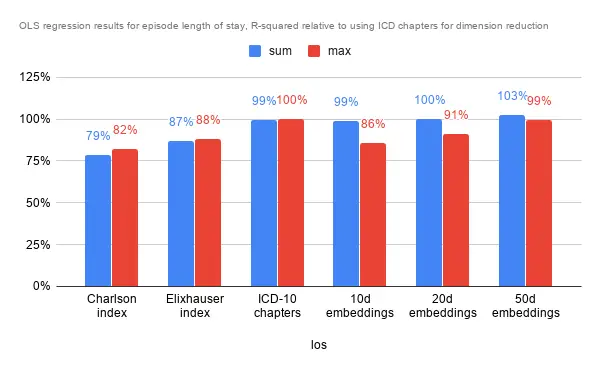
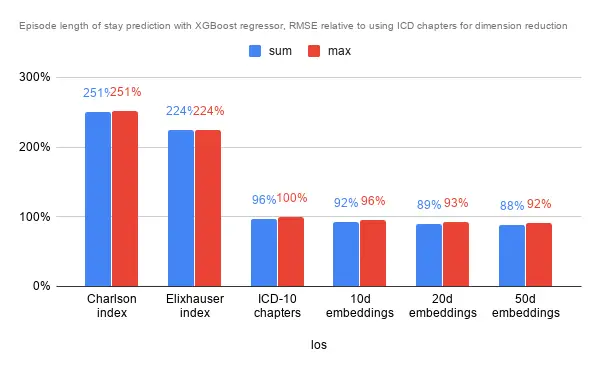
Predicting Inpatient Episode Length of Stay
Interestingly while the aggregation method did not seem to have much impact on predicting episode cost, the effect was pretty pronounced for lower dimensional embeddings. Again, performance was pretty similar for ICD chapters, the 10 and 20 dimensional embeddings, while performance is slightly poorer on comorbidity indexes and marginally better with the 50 dimensional embeddings.
As for RMSE with the default XGBoost regressor, performance was similar to predicting episode cost. Error rates for the comorbidity indexes were over twice as much as the benchmark (ICD chapters), and slightly better with the embeddings.
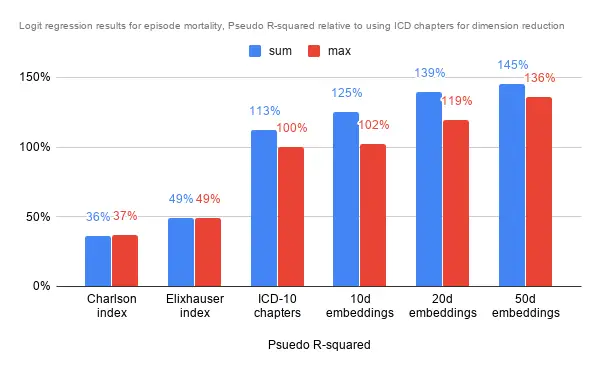
Predicting Inpatient Episode Mortality
The analysis was a little different for predicting episodic mortality. As it was a classification, I went with a logit regression to approximate how much the dimensions explain the end result. Further, as the data is very imbalanced (thankfully so), I oversampled on the minority class in the training set to obtain a balanced training set. Here, summing along the dimensions provided significantly more information in predicting mortality than simply taking the maximum. It could mean that the magnitude along each dimension is vital to the prediction.
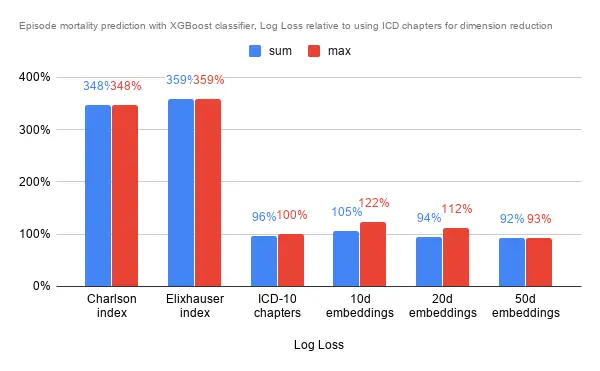
As it was a classification problem I used the XGBoost Classifier rather than the regressor, however also using default settings for all. The comorbidity indexes fare about 3x worse in terms of Log Loss compared to using ICD chapters, and 10d embeddings actually fare quite a bit worse than the ICD chapters too. Only 50d embeddings was able to provide noticeably better results, though not significantly better too.
Conclusion
As it turned out (unintentionally), the ICD chapter groupings as a form of dimension reduction fared pretty well, and the embeddings performance against it was often not significantly better. Comorbity indexes appear to not come close in performance for any of the chosen tasks. Nonetheless the initial results seem to suggest that the embeddings, especially at 50 dimensions, are able to capture more information about the diagnosis codes than ICD chapter groupings (and the comorbidity indexes).
These quick embeddings are unlikely to be ready for clinical purposes in the foreseeable future, but could potentially be used for operational and finance purposes in a healthcare setting such as in long term hospital resource planning, or in improving early bill estimates for a better patient experience, among many others. Other applications could also involve understanding population disease progression to mitigate or prepare for it, or reorganization of healthcare resources around similar diseases and progressions.
As mentioned earlier, any analysis or model that can benefit from having diagnosis information would likely benefit from having a general purpose embeddings layer as an input. Given the nature of it, many finance and operational problems in a hospital would likely fall into this category. Hoping to be able to put this first iteration to use while developing the embeddings further. Looking forward to some good results!