My initial attempt at projecting Singapore’s population for the next 2 decades with as simple a model as possible. Another work related task as population has been established (or assumed?) as a key predictor of healthcare resource utilization. While official projections are not easy to get hold of, I figured it’ll be worthwhile making a quick projection using publicly available historic data. This will be at the annual level, by age groups. I’d then be able to proceed with our projects, and updating the model if the official projections are eventually obtained.
Historic data on Singapore’s resident population from SingStat
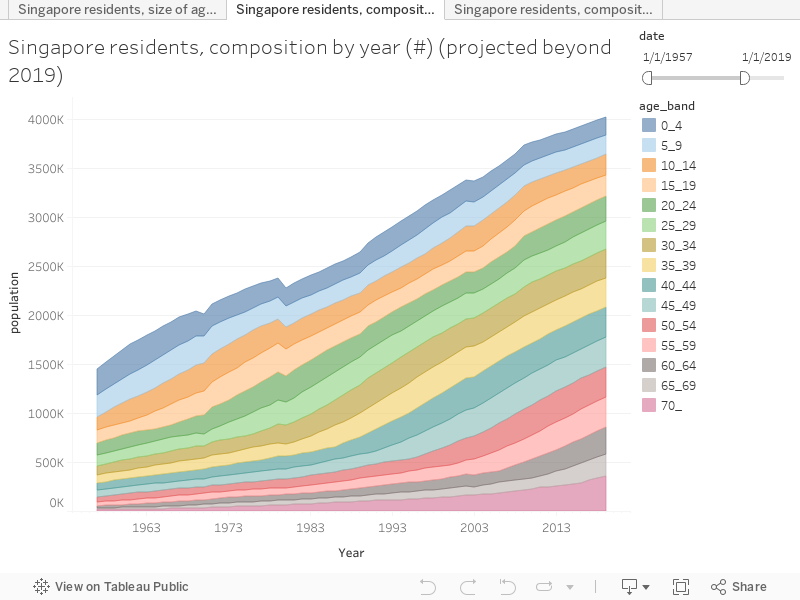
SingStat provides annual number of Singapore residents by age group, ethnic group and gender from 1957. For this project I decided to take just age group level data by year. With regards to definitions, there’s a distinction between citizens, residents, and population. While data on residents stretches back to 1957, this is not the number of Singapore citizens. It is also not the total number of people in Singapore, which includes non-residents.
Age groups are defined in 5 year bands, 0 to 4 years, 5 to 9 years and so on. The breakdowns for the oldest age bands was not consistently available from the start of the data though. For example in 1957 the oldest bounded age group is 80 to 84, the last group being 85 and above. For the next 12 years the oldest bounded age group was 65 to 69. This fluctuated for a bit before being fixed to 80-84 in 1990, and 85-89 in year 2000. To keep everything consistent I took the last bounded age group to be 65 to 69 throughout. I aggregated the rest where available to the 70 and above group. Works generally, but some issues pertaining to this surface later.
Thought process behind the simplified population projection model
The number of residents an age group on a specific year can be broken down into a few components:
- Residents from the same age group the previous year, who had aged a year but remained in the same group
- Residents from the preceding age group who had aged a year and left their previous group. They’d thus enter the age group in question
- Residents of that age group who were not reflected in the previous year’s numbers. Possibly due to immigration, changing of residency status or other factors
The first and second points can be expressed as functions of the previous period’s population. I.e.:
Population[age group X, year t]

Function-A(Population[age group X, year t-1])
 +
Function-B(Population[age group X-1, year t-1])
Assuming even distribution within a age band (size of each age is same within the band, or 20% each), no one leaving the age groups (through deaths or migration) and no one new entering the age groups, this function will be:
Population[age group X, year t]

80% * Population[age group X, year t-1]
 +
20% * Population[age group X-1, year t-1]
These assumptions are not realistic. People do die or leave the country. Immigration can also increase the size of an age group beyond the above modeled size. The inflow of foreigners is especially significant for Singapore in the middle-age age groups, given Singapore’s need for foreign labor to sustain most industries. Correspondingly, when they decide to return home, a few years later or when they retire, there’ll be a larger outflow than approximated in the one model above. This would lead to multipliers being smaller than 80 and 20 percent respectively.
The linear population projection model
However, assuming the relationship between each year’s age group’s size to be approximately constant within an appropriate window, the following can be modeled from the data:
Population[age group X, year t]

Constant-A * Population[age group X, year t-1]
 +
Constant-B *Population[age group X-1, year t-1]
The constants above will have to be modeled separately for each age group. Next, the function will not work for the smallest age group (0-4), without a prior age group. For that I have fitted an ARIMA model to approximate the change in the age group’s size over time. With the youngest age group projected, I ran the linear regression model for the next age group. With the coefficients for the next age group, I projected the size of that group up to 2050. I then repeated the process up to the last age group.
The model is linear not because it projects population in a straight line, but because it assumes the following year’s size of each age group be a linear function of the previous year’s.
Assumptions and limitations
One of the fundamental assumptions in the above model is that the relationships between a given age group’s projected year’s population and the previous year’s population remain approximately constant from the model fitting period to the projection period. This would include assuming the following to be constant:
- Proportion of people moving in and out of an age group through migration or changing of residency status. (constant proportion to either the number of people in that age group or the previous age group)
- Proportion of people dying in the age group. This would then require assuming approximately constant life expectancy from the model fitting to the projection period
- Government policies pertaining to residency status and inflow/ outflow of migrants (possibly the most dynamic and trickiest to predict)
Obviously things such as government policies and life expectancy do not remain constant over decades. To minimize the effect of these dynamic effects I used more recent data for fitting the coefficients. Finally, any major shifts in any of the above would invalidate the assumptions.
Visualizing the projections
I’ve put up the projections on a Tableau dashboard here. You can view the projections as individual line plots of age groups, or cumulatively in the area plot. The line chart seems to show an alarming trend of the above 70 group shooting over the roof with time. Before anyone panics, bear in mind that that’s only if all the assumptions mentioned above hold for the next 2 decades. In absence of more information, that’s likely the direction we’re heading at the moment.
Next steps
Over longer periods, the constants will unlikely hold. However I’d be interested to investigate how the ‘constants’ or relationships change over time, and if the assumption of the constants being valid for a short time window is even valid. Assuming they hold, the constants/ coefficients seem an interesting topic to explore on its own. None of them are exactly 80/20, though some come close. What stories could they tell? Won’t have time for these at the moment, but something to experiment with in future!