One interesting phenomenon observed in public healthcare is that when additional healthcare capacity, such as hospitals, are added, the resultant demand for healthcare resources seems to grows and fill the capacity. This effect is coined supply induced demand. Not to be confused with supplier induced demand, where the supplier of the good intentionally encourages consumers’ demand for the good. Nonetheless, the presence of supply induced demand creates a problem for planning of healthcare resources.
What is supply induced demand
For example, hospital A sees 500 patients a day when the optimal workload is 400 patients. A possible (simplistic) solution would be to add an additional hospital with capacity of 100. Maybe 200 for some allowance. Either way, the total number of patients at both hospitals should ideally add up to close to the original number (500), with some growth factor. However, what seemed to be anecdotally observed is that after hospital B is operational, while the workload at hospital A may drop initially, the total workload seems higher than before. Not long after, hospital A’s attendance is back at 500 a day, and hospital B is close to full capacity.
With this happening, demand today cannot be used to forecast demand tomorrow, if capacity will be added. However, if it is possible to forecast and quantify the impact of supply induced demand, planning for healthcare resources can be done in a more precise manner.
Observing supply induced demand from public datasets
In this post I’ll look at some public datasets to see if supply induced demand is observed from historic data of public hospital admissions. Is there evidence of supply induced demand, given the trend in public hospital admissions over the past few years? If there seems to be such a trend from the data, can that amount be quantified? How can we tell if any increases in demand are due to supply, and not a natural growth based on population?
Finally, I’ll briefly discuss some possible reasons for such a phenomena, while not getting into a detailed analysis of causes. To cut the suspense, I’ll be showing some indicators that seem to, but inconclusively, indicate the presence of supply induced demand with regards to public hospitals and hospital admissions. As a disclaimer, I’m analyzing this from the perspective of a data hobbyist, not as a healthcare or medical professional.
The visualizations below are also on Tableau Public here.
The data
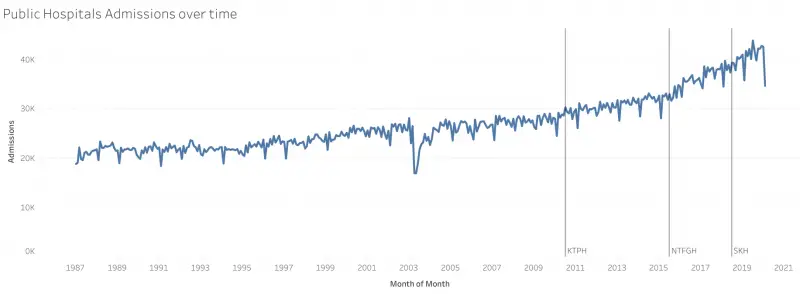
The dataset I’ll be using for this purpose is the Monthly Admissions To Public Sector Hospitals from SingStat. This contains the total monthly admissions to each of the public hospitals in Singapore since 1987.
As for the hospital openings observed, I’ll be using the most recent 3: Khoo Teck Puat Hospital (KTPH), Ng Teng Fong General Hospital (NTFGH) and Sengkang General Hospital (SKH).
Adapting methods from measuring effectiveness of TV ads on App Downloads
First, figuring out possible ways to see if there was an increase in admissions after the opening of each hospital. I remembered a previous analysis, evaluating if a TV ad impacted website visits or app downloads. One simple method used to measure such fleeting events was to measure the activity in question for a period before the event, and a similar period after the event. For example, app downloads/ activity 15 minutes before and 15 minutes after the ad was shown in the target market. Comparing these 2 values would give a rough idea if the ad had any impact on the target audience.
Many assumptions would have been built into such an analysis. For example, the activity had to be one which was realistic to complete within that time frame. If the ad was for shampoo, increase in sales won’t happen within 15 minutes, and a longer window is required. On the other hand, a shorter window would minimize the impact of other drivers of happening at the same time.
Measuring change in Public Hospital Admissions
Admissions to public hospitals, too, need to be observed over a longer period. Extending that model, I used a 12 month window before the hospital was added, and the subsequent 12 months after the hospital opened. I’ve chosen a window of 12 months so as to cancel out effects of seasonality throughout the year. The ratio of the average monthly admissions in the latter period to that of the earlier period would indicate if there was an increase. This is somewhat the gradient of the trend in admissions. If the gradient was more than 1, admissions had increased, and vice versa. Each month will have its calculated ratio, regardless of whether a hospital opened.
By comparing the ratios on the months when hospitals opened, to the overall distribution of ratios, it may be possible to make headway in concluding whether these increases are beyond the norm (possible supply induced demand), or if they are within the norm. A ratio of 1.05 would indicate a 5% increase in admissions in the leading 12 month period compared to the lagging 12 month period.
Rate of Change in Admissions Over Time
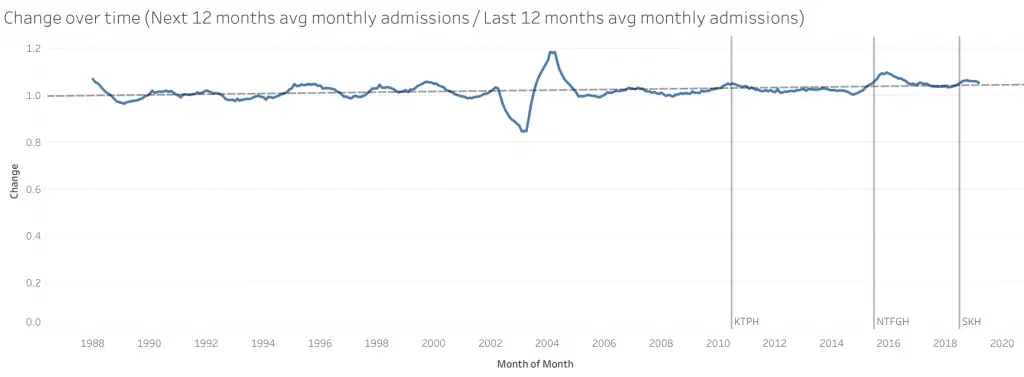
From this chart you can see a general upward trend in the rate of increase in admissions. At a rate of 3.90463e-06 per month, to be precise. On the total admissions chart, this shows up as an exponentially growing line (increasing at an increasing rate). In the absence of extraordinary events, the ratio hovers around this trend line.
The big dip and peak in the middle is during the SARS period. Presumably certain admissions were avoided, resulting in the dip. Following the recovery, due to the smaller base, the increase showed as a peak over the trend line. Each point is the ratio of the next 12 months average monthly admissions to the previous 12 months average monthly admissions.
Distribution of change in Public Hospital Admissions
As mentioned earlier, over longer periods, other forces come into play. An increase from the prior 12 month to subsequent 12 month may be due to population changes rather than the opening of the hospital. One way to see if there is a longer term trend going on, was to see the distribution of the calculated ratio. If there was a presences of a longer term trend in admissions, then the distribution of ratios won’t be centered around a mean of 1. If the peak of this distribution is beyond 1, it would indicate that admissions are on the whole, rising, regardless of hospital openings.
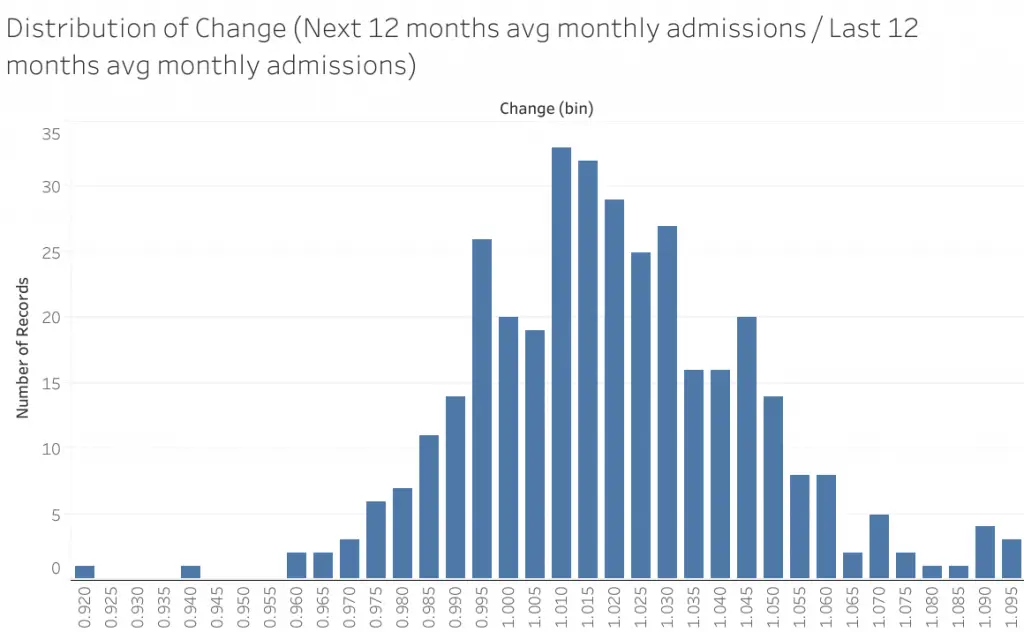
From this histogram plot, these ratios seem to follow a symmetric distribution slightly above 1 (approximately 1.01). This indicates that hospital admissions are on average, growing over time. Thus, just observing a ratio above 1 following the opening of a hospital would not immediately indicate supply induced demand.
Distribution of change in Public Hospital Admissions Over Time
Now, adding in the aspect of time, as color on the distribution chart below. Not only has the distribution shifted beyond 1, the ratio is increasing over time. The colors towards red, the later years, are towards the right. This tallies with the trend over time observed earlier. Thus ratios need to be evaluated not just against the distribution, but within the right time frame. Selecting only years after 2000 would yield a mean of ~1.02; after 2010, approximately 1.04.
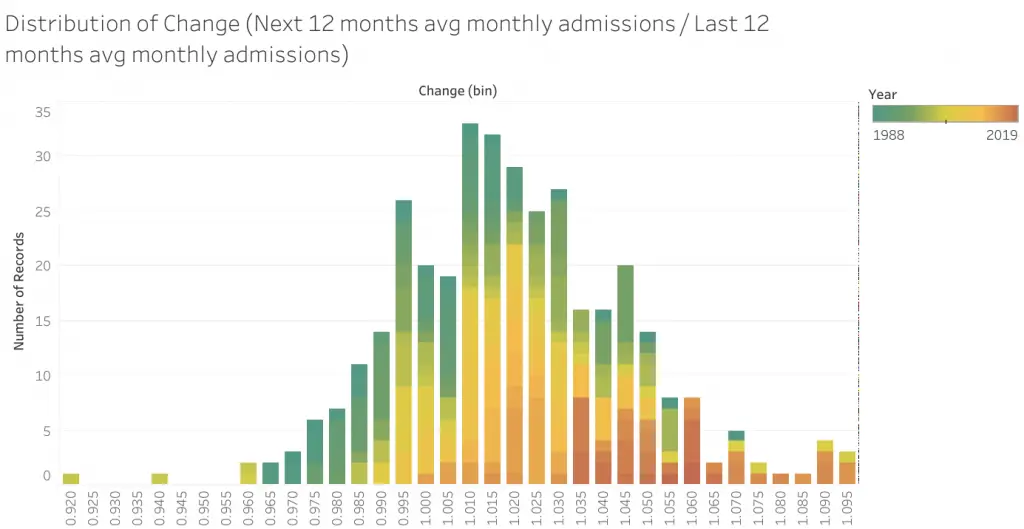
| Data From | Mean | Standard Deviation |
| 1987 | 1.0212 | 0.0393 |
| 2000 | 1.0265 | 0.0459 |
| 2005 | 1.0308 | 0.0226 |
| 2010 | 1.0404 | 0.0213 |
Pseudo Statistical Perspective
The ratios when the recent 3 hospitals opened are:
| Hospital | Opening | Change in Public Hospital Admissions |
| Khoo Tech Puat Hospital (KTPH) | June 2010 | 1.0478 |
| Ng Teng Fong General Hospital (NTFGH) | June 2015 | 1.0522 |
| Sengkang General Hospital (SKH) | July 2018 | 1.0546 |
From a statistical standpoint, though these values are above the mean for any of the data ranges selected, it falls within 1 standard deviation of the distributions. Unlikely sufficient evidence to conclude that there is supply induced demand.
Graphical Perspective
From an alternative analytical standpoint, taking a closer look at the ratios trending over time (Fig 2 from above, duplicated here), it does appear that when hospitals open there is a bump up in total admissions. This trending up starts before the hospital opens as it is a 12 month rolling window.
In KTPH’s case the peak is almost symmetrical about the opening of the hospital. It appears that the surge quickly subsided, and the surge might have eased demand a little such that the growth fell below the trend line for awhile after that.
In NTFGH’s case the surge is much more severe and lasts for half a year before peaking. Beyond that, the growth rate falls back to the trend line but does not go below it. This indicates that the additional surge in admissions did not go away like in KTPH’s case, but instead remained within the system. The growth rate slowed but admissions number remained at a higher level than before.
A similar but smaller scale of this seems to be happening at SKH, though there is not yet enough data to see through the trend.
These seem to indicate that there is usually a surge in admissions after the opening of a hospital, and these surges do not always go away. This in turn suggests that the additional hospital may have brought with it a higher level of demand. Do note that this is purely from a visual analysis, keeping in mind that such patterns may purely be my mind forcing a fit of the data to the imagined phenomena. Scant evidence, inconclusive in my opinion but seems to have hints of it.
Possible reasons for supply induced demand
If total admissions did increase with the addition of hospitals, what could be causing it? Hospital admissions aren’t frivolous affairs, so there has to be some sort of medical situation. It’s possible to visit the hospital on a whim (at a high cost to one’s wallet and to other patients), but it is difficult to get admitted to a ward on whim. Here are what I think may lead to the observed effect.
In clear cut scenarios, most people will concur on whether or not their circumstances warrant a visit to the hospital (for the possibility of admission). As such, if there could be increases simply due to presence of a hospital, it is likely to be in the grey area, where either the patient, caregiver, or attending physician might make a different decision based on whether they are near or at a hospital. Given that the hospitals are new, branding effects are unlikely to influence their decision between staying home or seeking help at a hospital.
From a patient / caregiver perspective
From a patient or caregiver’s perspective, there may be situations where it does not look serious enough, and the nearest hospital may be too far away. If there were a nearer hospital, it may change their minds given the convenience. These cases might turn out to necessitate an admission.
Furthermore, long wait times are usually associated with public healthcare resources. The addition of capacity may give the assurance that wait time is likely to be shorter. This may spur more patients to seek help for their medical condition. These conditions are also likely to fall within the grey area where it may be possible, but inconvenient to live with the condition.
From a physician’s perspective
On the other hand, there may also be cases where it might not be absolutely necessary for an admission, but could potentially benefit the patient. If the patient was at a GP and hospitals are far away, the hassle of the transfer may bring more stress to the patient. It may be in the best interest of the patient to not transfer to the hospital. However if the patient had visited the emergency department in the hospital, the admission may make more sense than going home.
Conclusion
More patients are seeking help and getting admitted may be a good thing. Communities have better access to healthcare and are getting their conditions treated. However, what this highlights is that there may be hidden pockets within the community who may require more medical attention. Uncovering these pockets will make it possible to plan capacity for entire communities in a more precise and efficient manner.